Dashboards
Live operational dashboards: the grid, every widget, data binding, metrics, the actions graph, spatial and attribute filters, breakpoints, refresh and the ops theme.
The model
A dashboard is a grid of widgets over one project. Widgets bind to datasets and metrics, emit events, and accept actions. Nothing is a screenshot: values come from the server on a refresh interval, and every widget carries an as-of stamp.
{
  variant: "dark",     // light · dark · ops
  refreshSec: 60,      // 0 turns polling off
  cols: 24,
  rowHeight: 36,
  gap: 12,
  showAsOf: true
}
Authoring
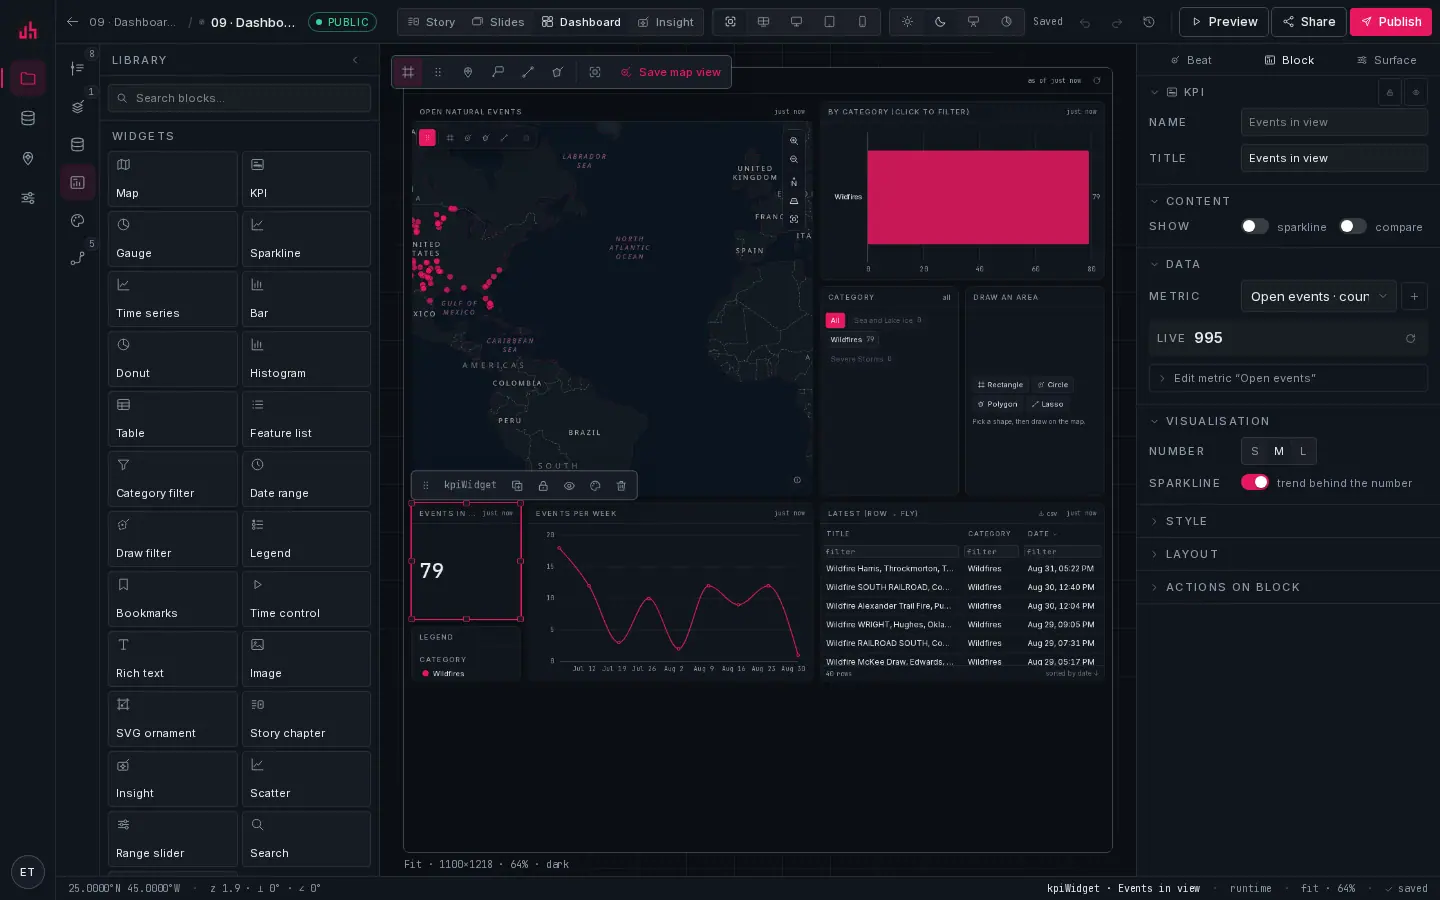
- Widgets: drag any of them onto the grid.
- Grid: 24 columns by default, 36 px rows, 12 px gap. Drag to move, drag an edge to resize; blocks snap.
- Map widget: as many as you like, each bound to its own beat.
- KPI: selected here, so the inspector shows its binding.
- Inspector: Data (dataset, metric, field) and Visualisation (encodings, sort, top-N, ramp) for the selected widget.
- Save map view: a dashboard's map widget saves a beat like any other map.
Every widget
The gallery below is a real published dashboard holding one of each, bound to a live sample dataset.
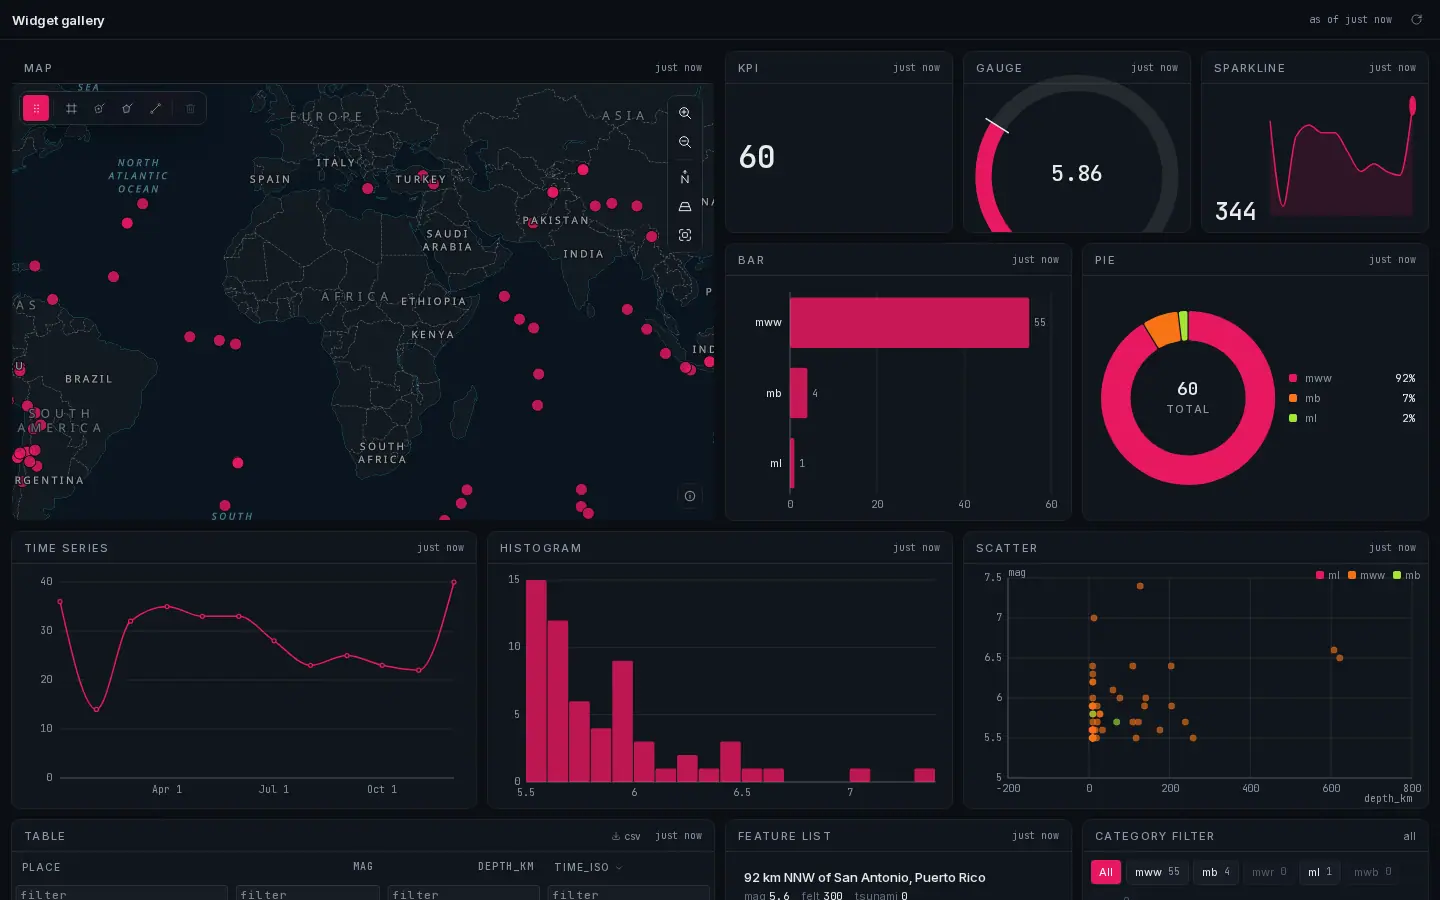
- Map: the spatial widget; every other widget can filter it and be filtered by it.
- KPI · gauge · sparkline: the single-number family.
- Bar and pie: categorical breakdowns, clickable.
- Time series · histogram · scatter: the distribution family.
| Widget | Binds to | Notes |
|---|---|---|
mapWidget | a beat, a layer | 2D or 3D; carries the spatial-selection toolbar when draw is on |
kpiWidget | a metric | big number, delta against the previous window, optional sparkline, threshold colours |
gaugeWidget | a metric | value between min and max |
sparklineWidget | a metric with a time series | trend only, no axes |
timeseriesWidget | a metric with a time series | line or area, bucketed |
barWidget | a metric with groupBy | horizontal or vertical, stack by a second field, top-N with the tail rolled into Other, sort, value labels, click to filter |
pieWidget | a metric with groupBy | pie or donut with a legend and a centre total |
histogramWidget | a dataset field | bin count; brush a range to filter |
scatterWidget | two numeric fields | optional size and colour encodings; drag to brush a selection |
tableWidget | a dataset | sortable, per-column filter row, sticky header, windowed above 1,000 rows, CSV export of exactly what is on screen, row click flies and flashes |
listWidget | a dataset | feature cards; follows selection and viewport |
filterWidget | a dataset field | multi-select chips with live counts, an all action, inner search past ten options |
rangeWidget | a numeric field | dual-thumb slider with the value histogram drawn behind the track |
searchWidget | a text field | debounced substring search; matches highlight on the map |
toggleWidget | a boolean-ish field | tri-state: any → on → off, with counts |
dateRangeWidget | a time field | 24h / 7d / 30d / All presets, explicit from and to values, and a brush over a mini histogram |
timeControl | a time field | playback across the time range |
spatialFilterWidget | a dataset | rectangle · circle · polygon · lasso, driving a map widget |
legendWidget | layers | classes as buttons; click to filter everywhere |
scaleWidget | the map | atlas scale bar and the current zoom |
bookmarkStrip | beats | one button per saved beat |
videoWidget | a dataset field holding a clip URL | plays the newest clip, lists the recent ones, two-way with the selection |
textWidget · imageWidget · svgWidget | nothing | narrative in the grid; svg takes raw markup (scripts and on* attributes are stripped) |
storyEmbedWidget | a published story | a chapter of another surface, framed |
insightWidget | a published insight | an Insight Container inside the grid |
Data binding
A widget binds to a metric or straight to a dataset field.
{
  "name": "Events in view",
  "datasetId": "<datasetId>",
  "aggregation": "count",
  "field": null,
  "groupBy": null,
  "filter": [">=", ["get", "mag"], 5],
  "spatialScope": "viewport",
  "timeseries": { "timeField": "time_iso", "bucket": "month" },
  "format": { "decimals": 0, "compact": true, "prefix": "", "unit": "" }
}
| Key | Values |
|---|---|
aggregation | count sum avg min max median distinct latest |
filter | a MapLibre expression, applied before aggregating |
spatialScope | all · viewport (recomputes as the camera moves) · selection · aoi (the drawn area) |
timeseries | a time field and a bucket: hour day week month year |
format | decimals, compact notation, prefix, unit |
Values come from /api/live/metrics/:id with an ETag; the viewer polls every refreshSec and a 304 costs nothing. Metrics with spatialScope: "viewport" recompute server-side against the current bounding box.
The inspector's Data section builds all of that with pickers. They are typed, so a numeric-only field never appears where a number is required, and there is a filter expression escape hatch for the cases the pickers do not cover.
The actions graph
"When A happens, do B." Every widget emits events; every widget accepts effects.
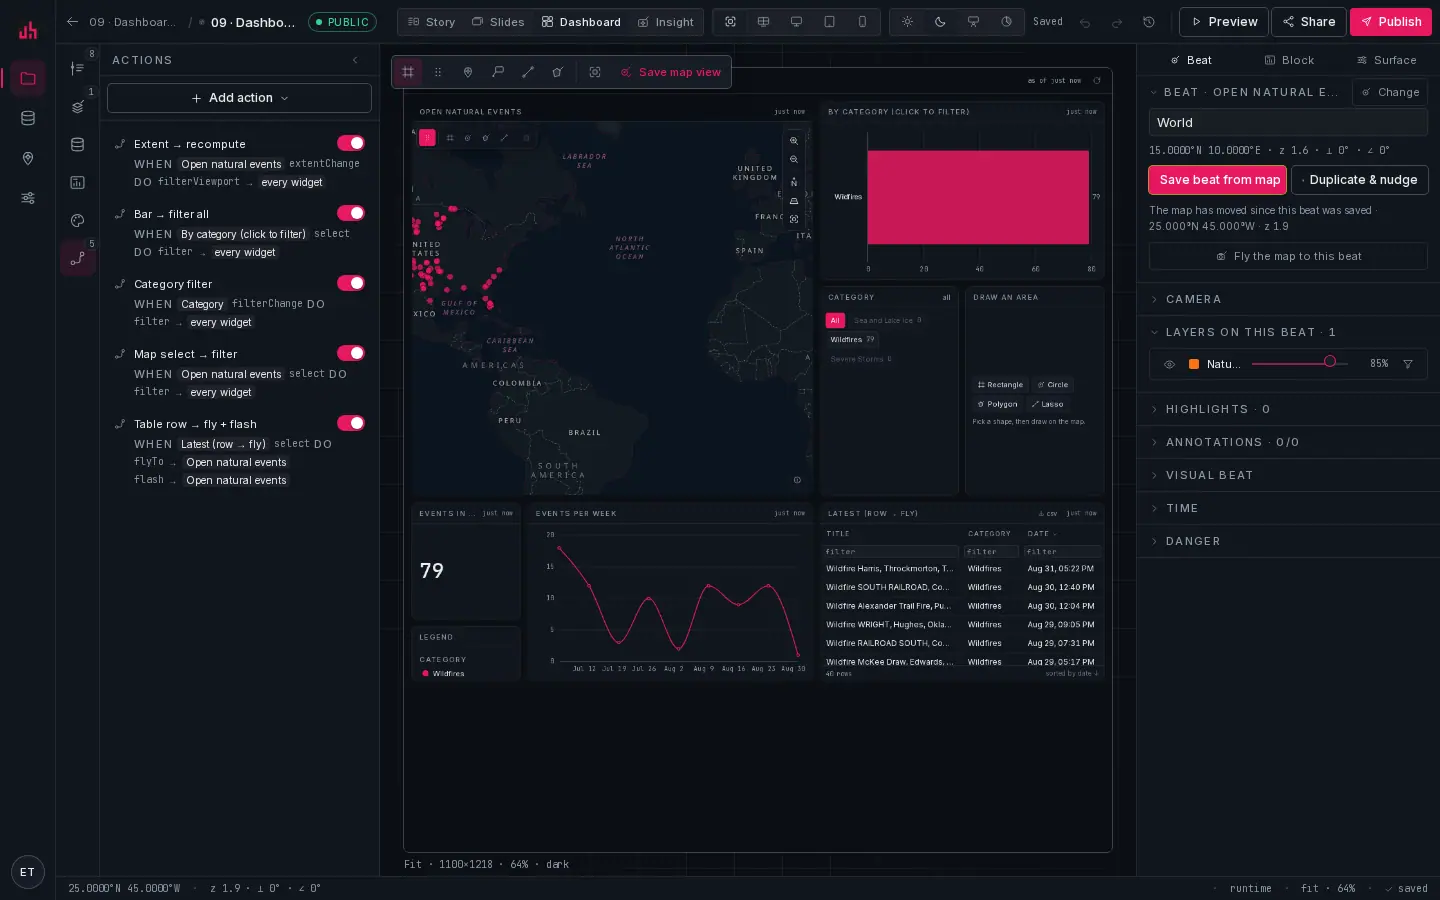
- Add action: pick a source widget, an event, a target and an effect.
- Extent → recompute: the map's
extentChangere-scopes every viewport metric. - Bar → filter all: clicking a bar writes a category filter that every widget honours.
- Map select → filter: clicking a feature filters the rest of the dashboard.
- Table row → fly + flash: selecting a row flies the map and flashes the feature.
- Enabled: every rule can be switched off without deleting it.
| Event | Emitted by |
|---|---|
select | map click, bar/pie click, table row, list item, scatter brush |
filterChange | category filter, range slider, search, toggle, date range, spatial filter |
extentChange | a map widget, when the camera settles |
timeChange | the time control and the date range |
hover · click | any widget |
| Effect | Does |
|---|---|
filter | writes into the shared filter store; every bound widget narrows |
filterViewport | re-scopes viewport metrics to the current bounding box |
highlight · flash | rings or pulses matching features on the map |
flyTo · setBeat | moves a map widget |
setTime | moves every time-aware widget |
clearFilter | resets one target or all of them |
open | opens a URL |
The target is a widget id, map for the first map, or * for every widget.
A new dashboard is wired for free. Without a single explicit action you already get: map extent → recompute viewport metrics; bar / category filter / range / search / toggle → filter everything; map select → filter; scatter brush → select. Add rules only when you want something other than the obvious.
Spatial filters: draw an area
The map widget carries a glass toolbar: pointer · rectangle · circle · polygon · lasso · clear.
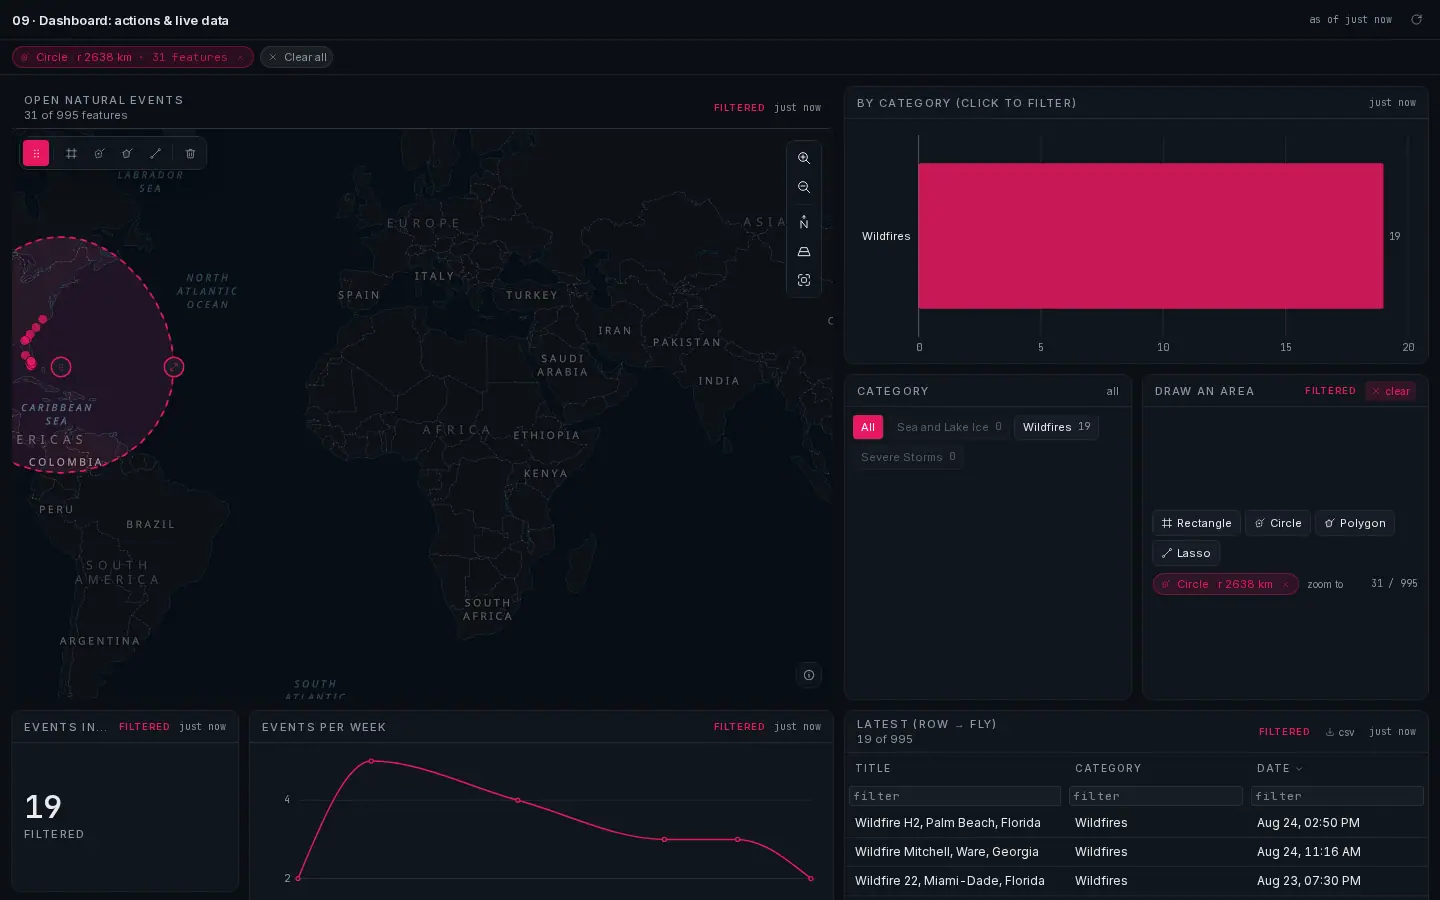
- Draw toolbar: pick a shape, then draw on the map.
- Filter chip:
Circle · r 3330 km · N features, with an × to clear it. - Clear all: removes every active filter at once.
- Feature count:
N of 995 featuresunder the map title. - Spatial filter widget: the same area, with a zoom to action and a live count.
- Filtered badge: every widget the area is narrowing says so in its header.
- Circle: click and drag from the centre; a live
r 872 kmreadout follows the cursor, and two handles (centre to move, rim to resize) stay on the shape. - Polygon: click vertices,
double-clickorEnterto finish,Escto cancel. - Lasso: freehand; the path is simplified before it becomes a ring.
- Everything outside the selection is dimmed by a mask layer, so the shape reads as a selection rather than decoration.
The result is stored as a GeoJSON polygon (a circle becomes a 64-gon) with the drawing intent kept in properties (shape, center, radiusM), so the toolbar can reopen it. Client-side widgets intersect it directly; server-side metrics receive it as the aoi parameter, validated (Polygon or MultiPolygon, closed rings, ≤ 20,000 vertices) before it reaches PostGIS.
noteon a dataset served as vector tiles the client only holds what the viewport loaded, so the map dims correctly and server-side metrics are exact, but a client-side feature count describes the loaded tiles.
Video
Some feeds carry a clip per feature — a fire that ignited an hour ago and a fifteen-second render of how it spread, a camera that woke up, a drone pass. videoWidget puts that on the dashboard as a player with a playlist, bound to a dataset the same way a table is.
It expects three properties on the feature, and none of them are magic names you cannot change:
| Property | Default field | Contract |
|---|---|---|
| clip | video_url | a direct URL to an MP4 (or any format the browser plays). A feature without one is not a clip and never appears |
| still | poster_url | shown before playback and as the playlist thumbnail. Optional |
| expiry | expires_at | an ISO timestamp. Once it is in the past the clip disappears from the list. A feed that signs its URLs for 48 h can say so, and the dashboard stops offering dead links |
Order comes from the dataset's own time field unless you name another one; features whose time cannot be read sink to the bottom. maxItems caps the list at 12 by default.
{
  "type": "Feature",
  "geometry": { "type": "Point", "coordinates": [29.05, 36.62] },
  "properties": {
    "name": "Fethiye ridge",
    "video_url": "https://cdn.example.com/clips/f-2291.mp4",
    "poster_url": "https://cdn.example.com/clips/f-2291.jpg",
    "ignition_time_est": "2026-09-11T04:12:00Z",
    "expires_at": "2026-09-13T04:12:00Z",
    "tier": "T2",
    "status": "active"
  }
}
{
  mode: "playlist",          // playlist · selected · url
  datasetId: "<datasetId>",
  urlField: "video_url",
  posterField: "poster_url",
  titleField: "name",
  subtitleField: undefined,
  timeField: undefined,      // default: the dataset's time field
  expiresField: "expires_at",
  sortDesc: true,            // newest first
  maxItems: 12,
  autoplay: true,            // always muted; never starts under prefers-reduced-motion
  loop: false,
  controls: true,
  followSelection: true,
  emptyText: undefined,
  url: undefined             // mode "url" only
}
Three modes. playlist is a player plus every recent clip. selected is the player alone, following whatever the surface has selected — pair it with a table or a map and it becomes a detail pane. url is one fixed clip and no dataset at all.
It is wired both ways. Clicking a clip selects its feature, so the map flies and flashes and the table highlights the row; selecting that feature anywhere else switches the player to its clip. Turn followSelection off and the widget keeps to itself.
What a live refresh does. Until the viewer touches the widget, the player follows the newest clip — leave a wall dashboard alone and it always shows the latest ignition. The moment they pick a clip, press play or scrub, the widget stops swapping the source under them; a New clip button appears in the header instead, and it switches only when clicked. Autoplay is muted (browsers require it) and does not start at all when the viewer asks for reduced motion.
Any field the feature carries — tier, status — is rendered as a chip next to the title when you name it in badgeFields.
Attribute filters
Filters compose with AND. Every widget that is being narrowed shows a filtered badge, the header carries one removable chip per active filter plus Clear all, and the whole state is mirrored into ?f=<compact JSON> and restored on load, so a filtered view is a link.
| Widget | What it writes |
|---|---|
filterWidget | a set of category values |
rangeWidget | a numeric range; the histogram behind the track is computed from what survives every other filter |
searchWidget | a like pattern on a label field |
toggleWidget | true / false / any on a boolean-ish field |
dateRangeWidget | a time window |
legendWidget | with click to filter on, hides that class everywhere |
histogramWidget · scatterWidget | a brushed range or a feature selection |
Refresh, as-of and stale
refreshSec on the dashboard sets the poll interval (60 s by default; 0 stops polling). Each widget shows as of HH:MM:SS. After three consecutive failures on the underlying connection the widget goes hatched and reports last success N minutes ago. Nothing is quietly wrong. See Data & live sources.
The published dashboard
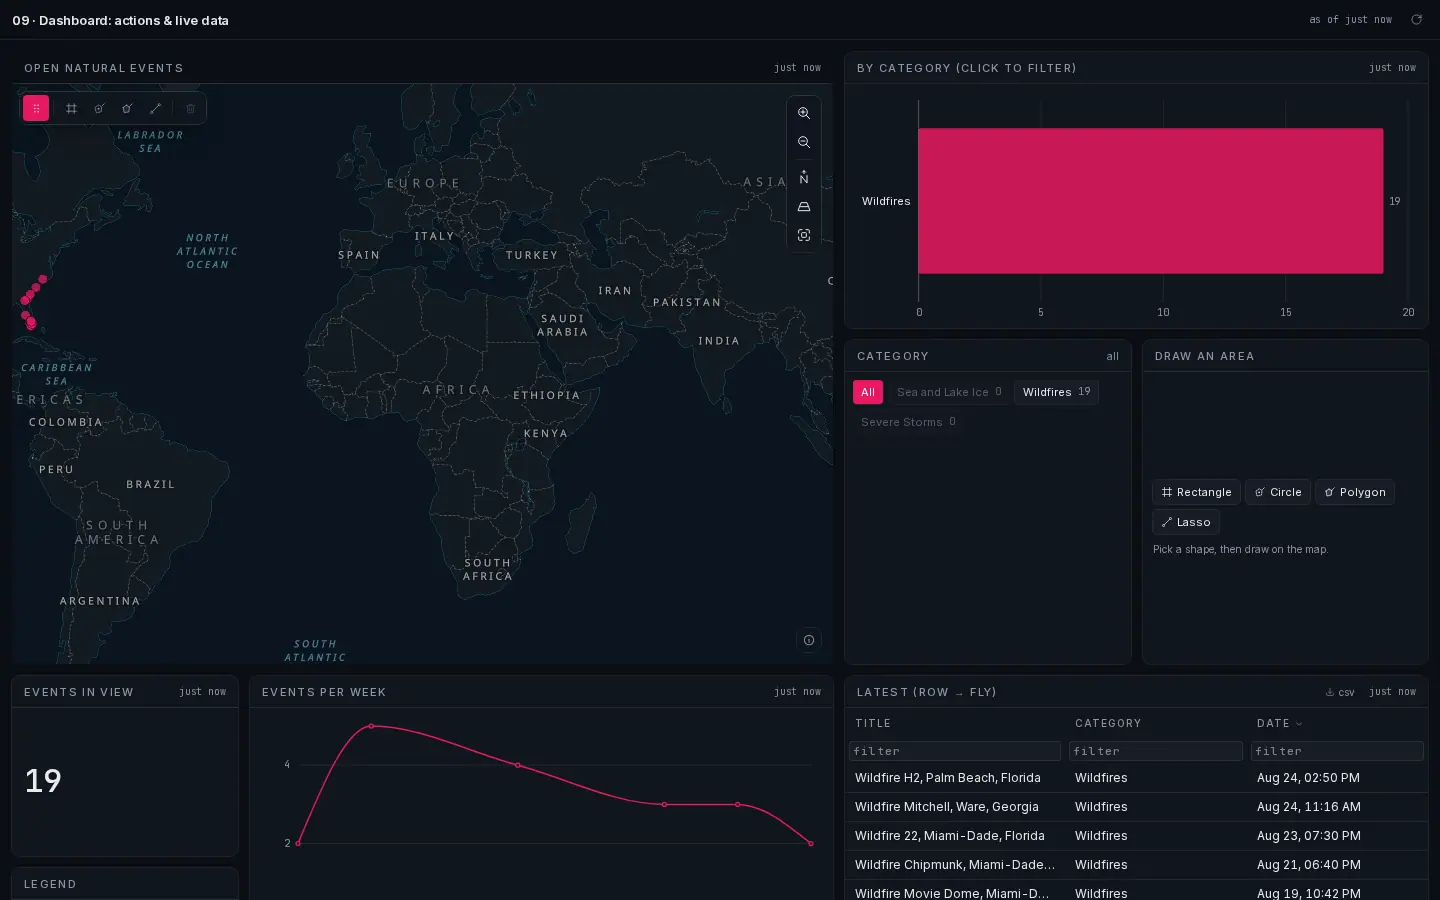
- Map: pan, zoom, click a feature; the draw toolbar is top-left.
- Bar: clicking a bar filters everything else.
- Category filter: chips with live counts.
- Draw an area: the spatial filter widget, when you would rather not draw on the map itself.
- KPI: recomputed for whatever is in view.
- Table: sortable, filterable, CSV-exportable; a row click flies the map.
- As-of: when this data was last fetched, and a manual refresh.
Breakpoints
Each widget carries a grid rectangle per breakpoint: wall, desktop, tablet, phone. Placing a widget sets desktop and wall together; tablet and phone fall back to full width unless you place them. Switch breakpoint with the Preview width control and drag. You are editing that breakpoint's layout, not the others.
The ops theme
variant: "ops" is pure black, high contrast, 17 px base type and tighter radii, built for a wall display read from across the room. night is a softer dark for a room with people in it. See Theming.
Alerts
Any metric on the dashboard can carry an alert rule: a comparison, a threshold, an optional area or time scope, recipients and a cooldown. Rules are evaluated after every refresh of the underlying source.
Performance notes
- Under about 5,000 features filtering happens client-side against the cached features; above that, metrics keep going to the server with
bbox,whereandaoi, memoised per key. - Search debounces and only touches the filter store, so no keystroke causes a refetch.
- The table windows above 1,000 rows; the scatter caps at 6,000 points.
- Drawing an area re-serialises only the mask and the ring, never the dataset.
Verified on 2026-09-02 against the local development build: the widget gallery above is a dashboard this documentation's screenshot script builds, publishes and photographs; the AOI figure is a circle drawn in a real browser on the published sample dashboard, with the resulting counts read back from the page.
Something wrong or missing? Write to hello@spatly.io.