Getting started
From a file on your disk to a published spatial story, slide deck, dashboard or insight card: in about ten minutes.
What Spatly is
Spatly is a spatial studio. One project holds datasets, layers, styles, live bindings and beats (saved map states). From that one project you publish up to four kinds of surface:
| Surface | Read by | Navigation | Live by default |
|---|---|---|---|
| Story | the public, readers | scroll | no, frozen snapshot |
| Slides | a room, a board | keys · click · swipe | no, frozen snapshot |
| Dashboard | an operations team | always on | yes |
| Insight Container | anyone, anywhere | collapsed card → expanded workspace | yes |
They share everything. A beat saved for chapter three of a story is the same object a slide flies to and a dashboard bookmarks. Switching surface does not copy data; it gives the same project a different reading order.
1. Create a workspace
Sign up at /signup with e-mail or Google. A workspace is created for you. The Free plan gives you 2 projects, 5 datasets, 50 MB of storage (10 MB per file), 1 live binding refreshing every 30 minutes, 3 AI story generations a month, 1 seat and the MCP server. See Plans & limits.
2. Start from data
The fastest path is the drop zone on the app home. Drag a file onto it, or press Browse, and Spatly ingests the file, creates a project, adds the first layer and opens a story in the Studio.
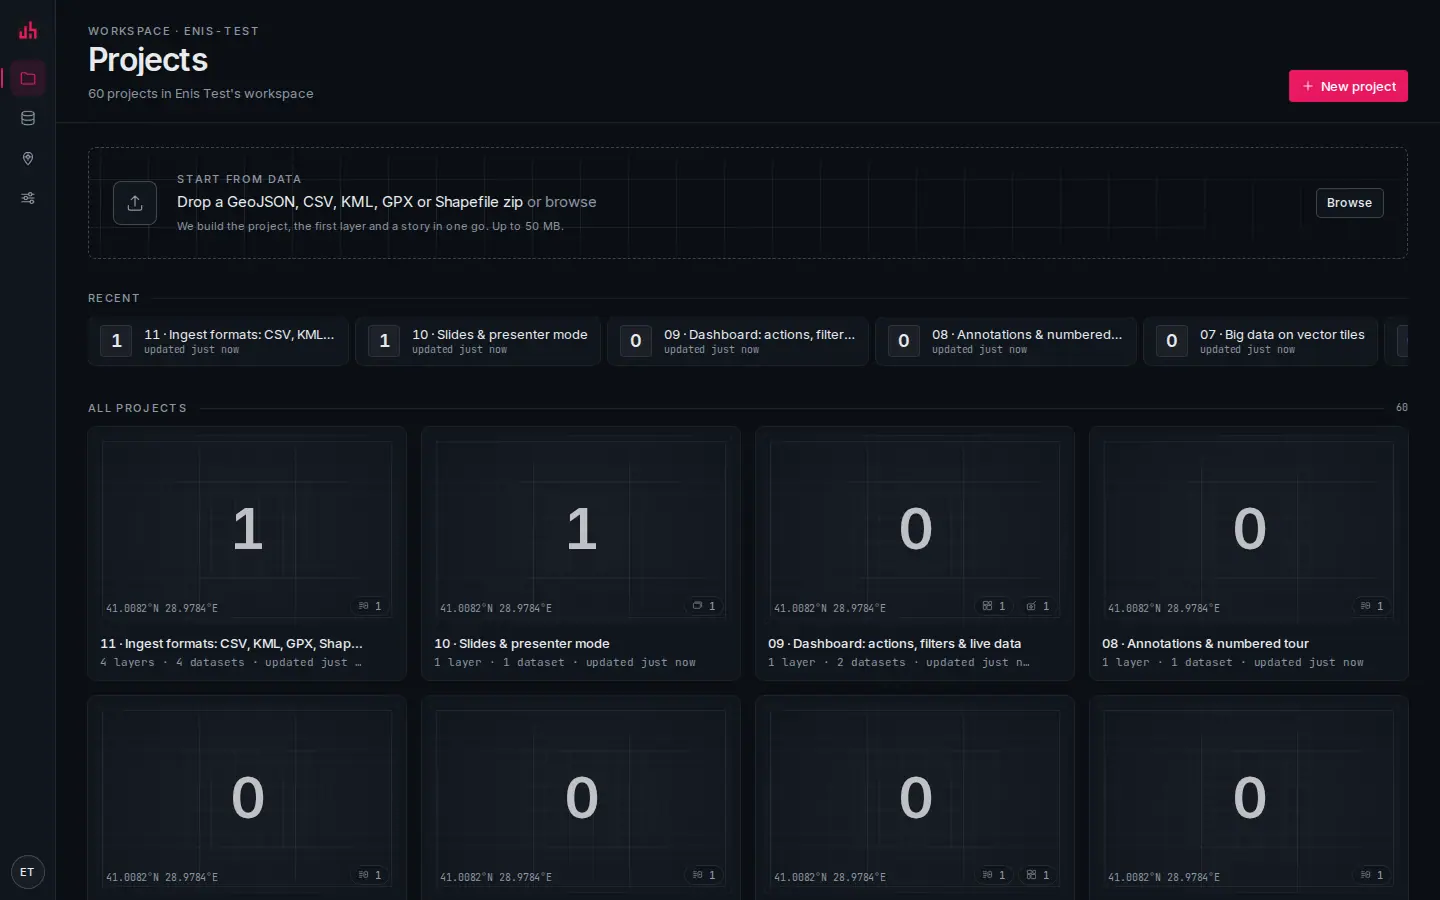
- Workspace rail: Projects, Data, Marks and Settings. It stays in place everywhere in the app.
- New project: an empty project when you want to pick the basemap and add data yourself.
- Start from data: drop a GeoJSON, CSV, KML, GPX or a zipped Shapefile here, up to your plan’s file size (10 MB on Free, 50 MB on Pro and Team). Spatly builds the project, the first layer and a story in one go.
- Browse: the same thing through a file picker.
- Project card: a static map frame of the cover beat, layer and dataset counts, and the last edit. Click it to open the project.
Accepted in this step: GeoJSON, CSV with lng/lat (or an address column), KML, GPX, zipped Shapefile, PMTiles. Bigger and live sources are covered in Data & live sources.
curl -X POST https://spatly.io/api/v1/upload \
  -H "Authorization: Bearer spk_…" \
  -F file=@airports.geojson
3. Look at what ingest found
Every field is sampled at ingest: type, role (id · label · category · measure · time · lng · lat), min/max, distinct count and nulls. That is what lets the style editor offer you the right classification without you counting anything.
Open Data in the rail to see it.
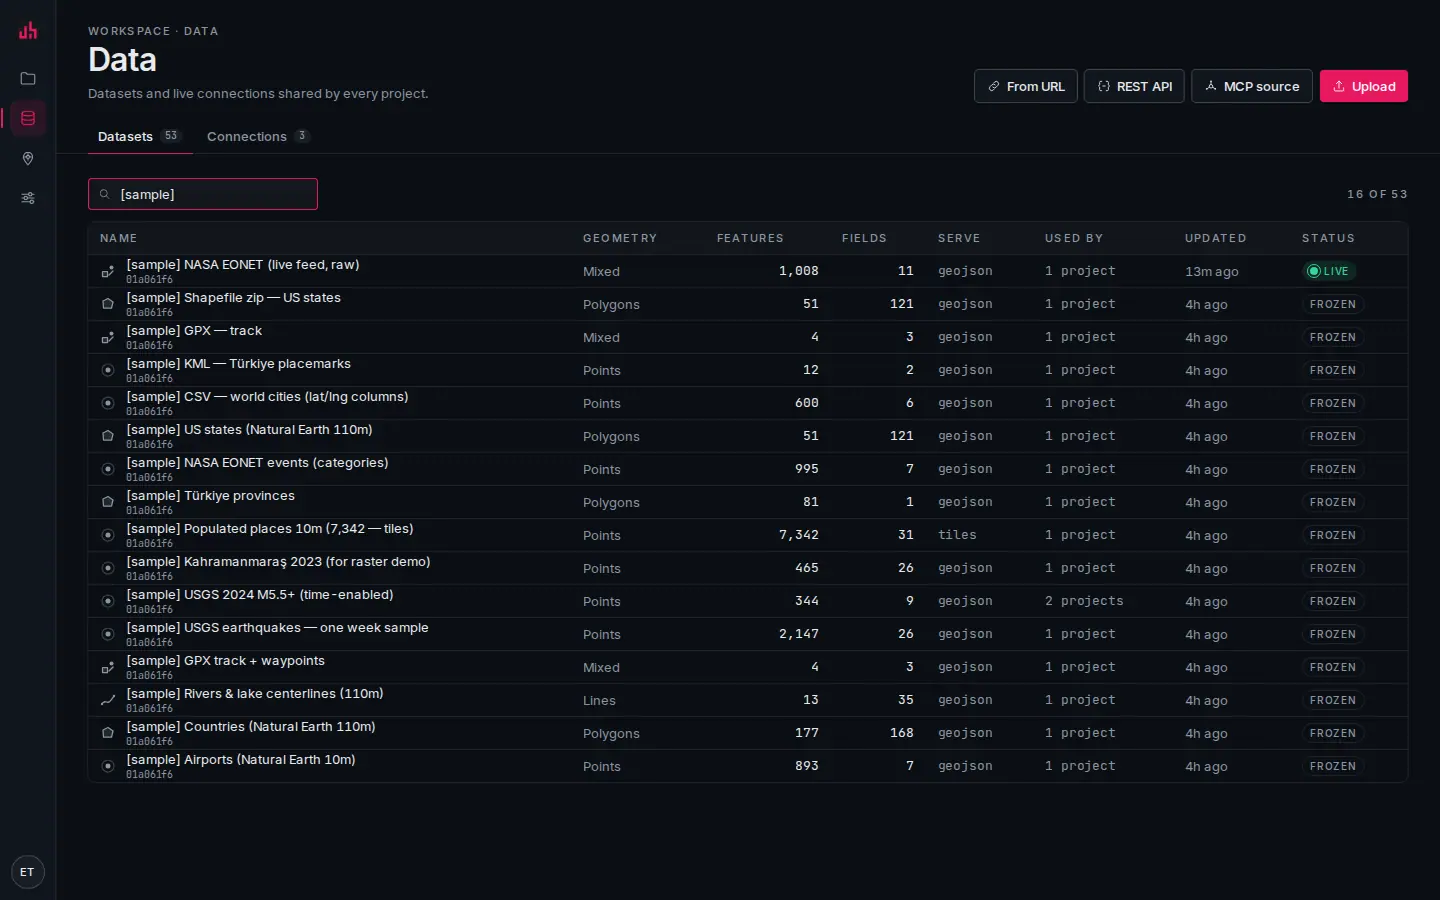
- Upload: a file from your disk.
- From URL: a GeoJSON, PMTiles, XYZ or TileJSON address that can refresh on a schedule.
- REST API: an authenticated endpoint with headers, a records path and a field map.
- MCP source: a tool on your own MCP server becomes a dataset.
- Connections: the live sources behind these datasets, with health and refresh history.
- Filter: matches names as you type.
- Geometry: points, lines, polygons or mixed, detected at ingest.
- Serve:
geojsonunder about 5,000 features,tilesabove it (served as MVT from PostGIS). - Status:
LIVEwhen a connection refreshes it,FROZENfor an uploaded file.
4. Style the layer
Open the project in Studio and go to the Layers tab. Pick a render type, then either a flat colour or a classification over a field.
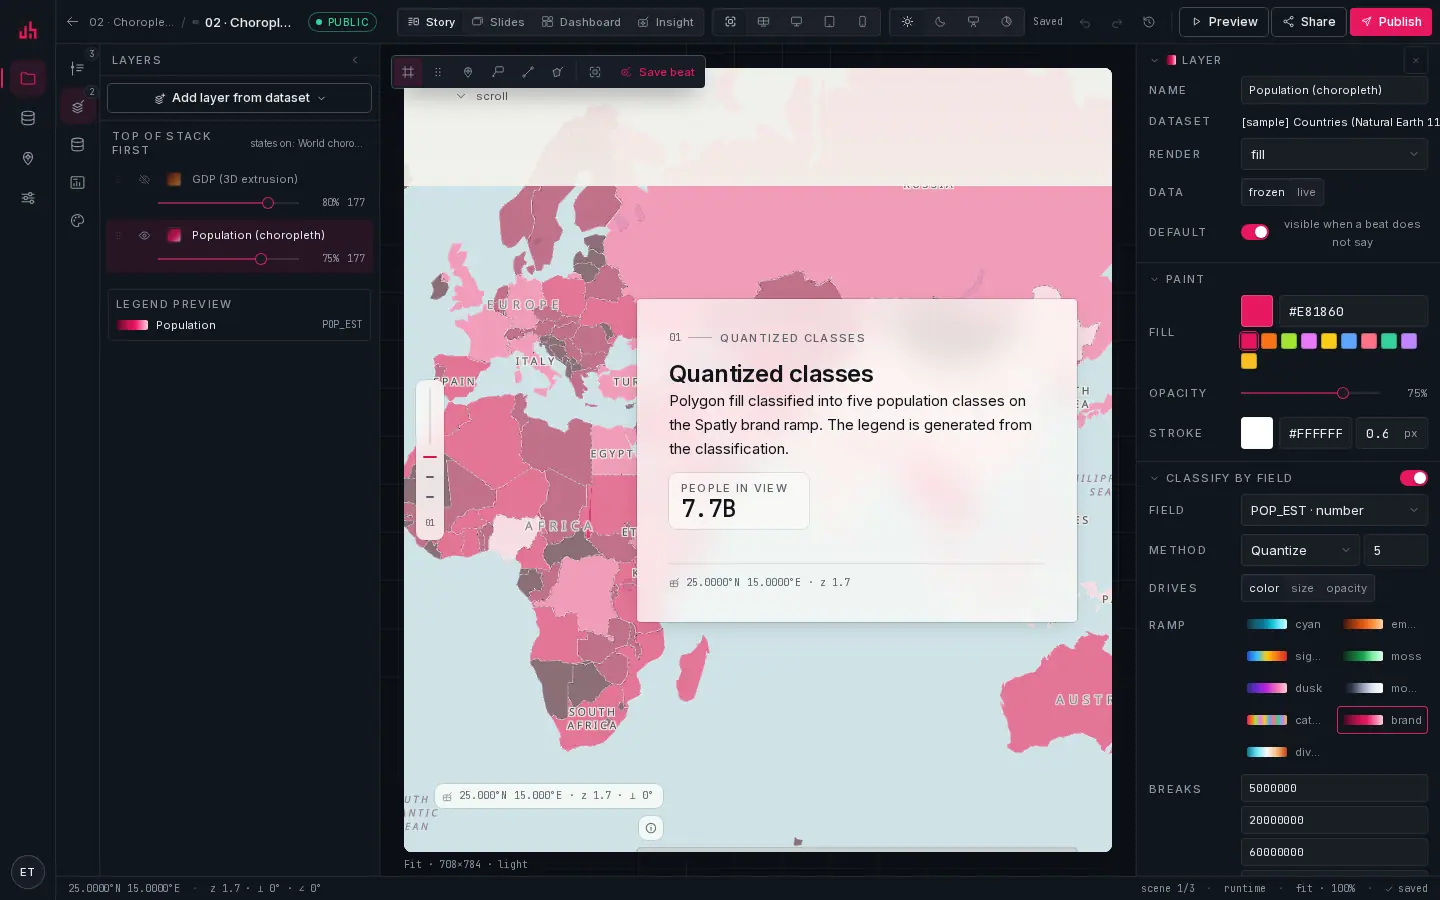
- Add layer from dataset: every dataset attached to the project is offered here.
- Layer stack: top of the stack draws first in the list, last on the map. Drag to reorder.
- Eye and opacity: per layer, and overridable per beat.
- Render: circle, fill, line, symbol, heatmap, fill-extrusion, raster or tiles.
- Classify by field: turn a field into colour, size or opacity.
- Method: categorical, quantize, equal interval, jenks or interpolate.
- Ramp: the built-in ramps; the brand ramp is first.
- Breaks: the class edges, editable by hand once the method has proposed them.
The full reference is in Layers & styling.
5. Save a beat
Move the map until it says what you mean, then press Save beat (or B). The beat records the camera, every layer's visibility, opacity and filter, the active annotations, the basemap, terrain and the time window.
Press Duplicate & nudge, move the camera, and you have chapter two. See Beats & camera.
6. Write the story
The Studio canvas is the real viewer, not a preview of it. Click text to edit it in place; press / for the block menu; @ mentions a layer, a feature or a KPI and stays live.
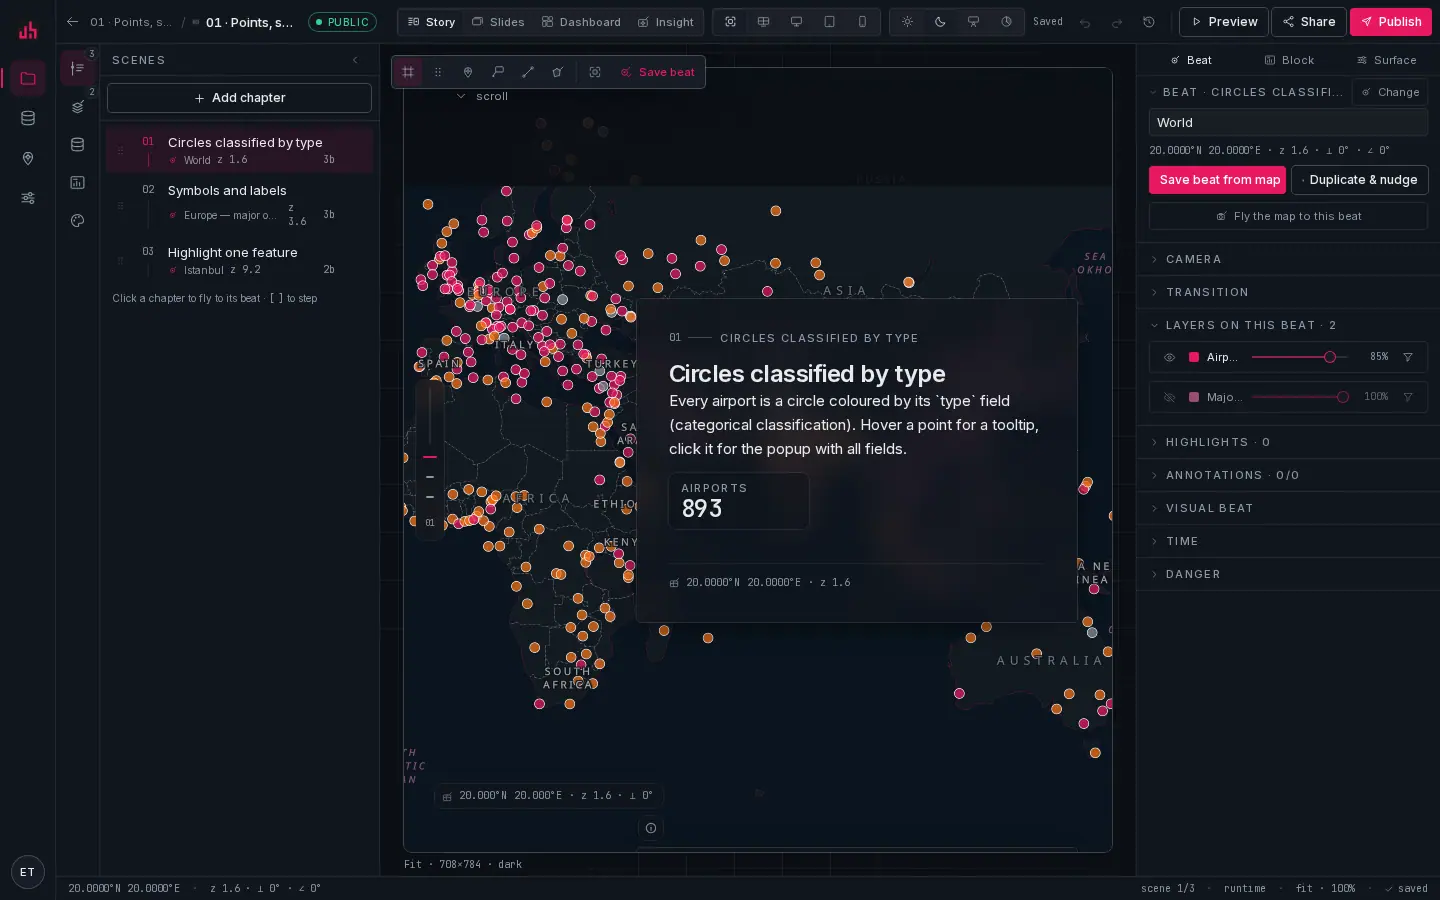
- Panel rail: Scenes, Layers, Data, Library, Design and (on dashboards and insights) Actions.
- Scenes: the chapters in order. Click one and the map flies to its beat; drag to reorder.
- Surface switch: the same project as Story, Slides, Dashboard or Insight. The menu also creates and converts.
- Canvas tools: select, pan, and the pin · callout · line · area drawing tools.
- Save beat: writes the current map state onto the active scene.
- Preview width: fit, wall, desktop, tablet, phone. Phone renders the real mobile layout.
- Theme variant: light, dark, night, ops. This is not a preview toggle: it is saved on the surface and is what gets published.
- Canvas: the published runtime, live and editable.
- Beat inspector: camera, transition, per-beat layer states, highlights, annotations, time.
- Status bar: cursor coordinates, zoom, pitch and bearing in mono.
- Publish: snapshot and go live.
7. Publish
Share opens the publish settings; Publish writes a snapshot immediately. Pick who can see it, copy the link or the embed snippet.
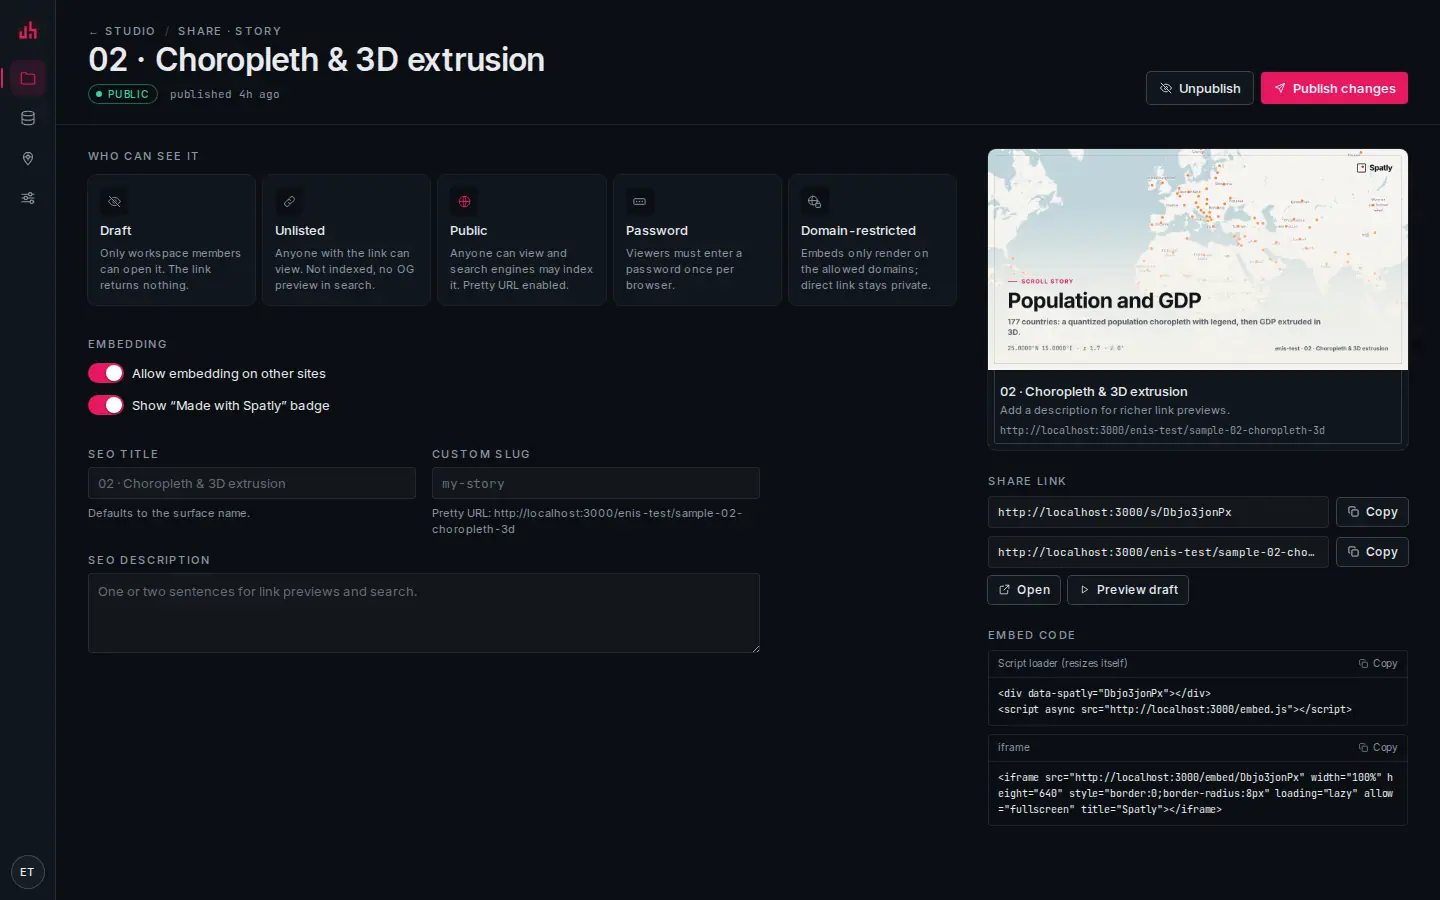
- Who can see it: draft, unlisted, public, password or domain-restricted.
- Embedding: allow other sites to frame this surface.
- Made with Spatly: the small plate bottom-left; removable on paid plans.
- SEO title and description: used for the link preview and the OG image.
- Custom slug: the pretty URL under your workspace.
- Share link: the short
/s/<publicId>link and the pretty link. - Embed code: the script loader and a plain iframe, both ready to paste.
- Publish changes: snapshots the current state. Nothing you edit reaches readers until you press it.
<div data-spatly="<publicId>"></div>
<script async src="https://spatly.io/embed.js"></script>
8. Or let an agent do it
Every plan includes the MCP server. Point Claude Desktop, Cursor or Claude Code at your workspace and ask for a six-chapter story from the dataset you just uploaded.
{ "mcpServers": { "spatly": { "command": "npx", "args": ["-y", "@spatly/mcp"], "env": { "SPATLY_TOKEN": "spk_…" } } } }
See MCP server.
Where to next
- Stories: chapters, narrative blocks, scroll tween, layouts, mobile
- Beats & camera: the one object every surface reuses
- Layers & styling: render types, classification, labels, popups, legends
- Dashboards: widgets, bindings, the actions graph, spatial and attribute filters
- Publishing: states, passwords, domains, OG previews, analytics
- Studio reference: every panel, the keyboard map, ⌘K and the AI features
Verified on 2026-09-02 against the local development build: this exact sequence, upload a GeoJSON, create the project and layer, save a beat, add a chapter, publish, then open /s/<publicId> and /embed/<publicId> signed out, was run end to end and passed 13/13 (apps/web/scripts/_docs-flow.mjs).
Something wrong or missing? Write to hello@spatly.io.