Layers & styling
Render types, classification methods and ramps, labels and marks, 3D extrusion, remote raster and vector tiles, interactivity and legends.
What a layer is
A layer is one dataset drawn one way. A project can have many layers over the same dataset, such as a choropleth and an extrusion of the same polygons, or circles and labels over the same points, and every beat decides which of them are visible, at what opacity, with what filter.
| Field | Meaning |
|---|---|
datasetId | the data. Omitted for a remote raster/XYZ layer, which carries remoteSource instead |
renderType | fill · line · circle · symbol · heatmap · fill-extrusion · raster · hillshade |
style | colour, opacity, stroke, size, dash, mark, labels, heat radius, height, classification, raw escape hatch |
baseFilter | a MapLibre expression that applies on every beat |
minzoom / maxzoom | hand-over between layers (a heatmap to zoom 9, circles from zoom 5) |
slot · zIndex | draw order: base → mid → top → label, then zIndex inside the slot |
dataMode | frozen (the snapshot taken at publish) or live (the viewer polls the source) |
timeField | makes the layer time-enabled |
defaultVisible | what happens on a beat that does not mention this layer |
legend | show it, and under what title |
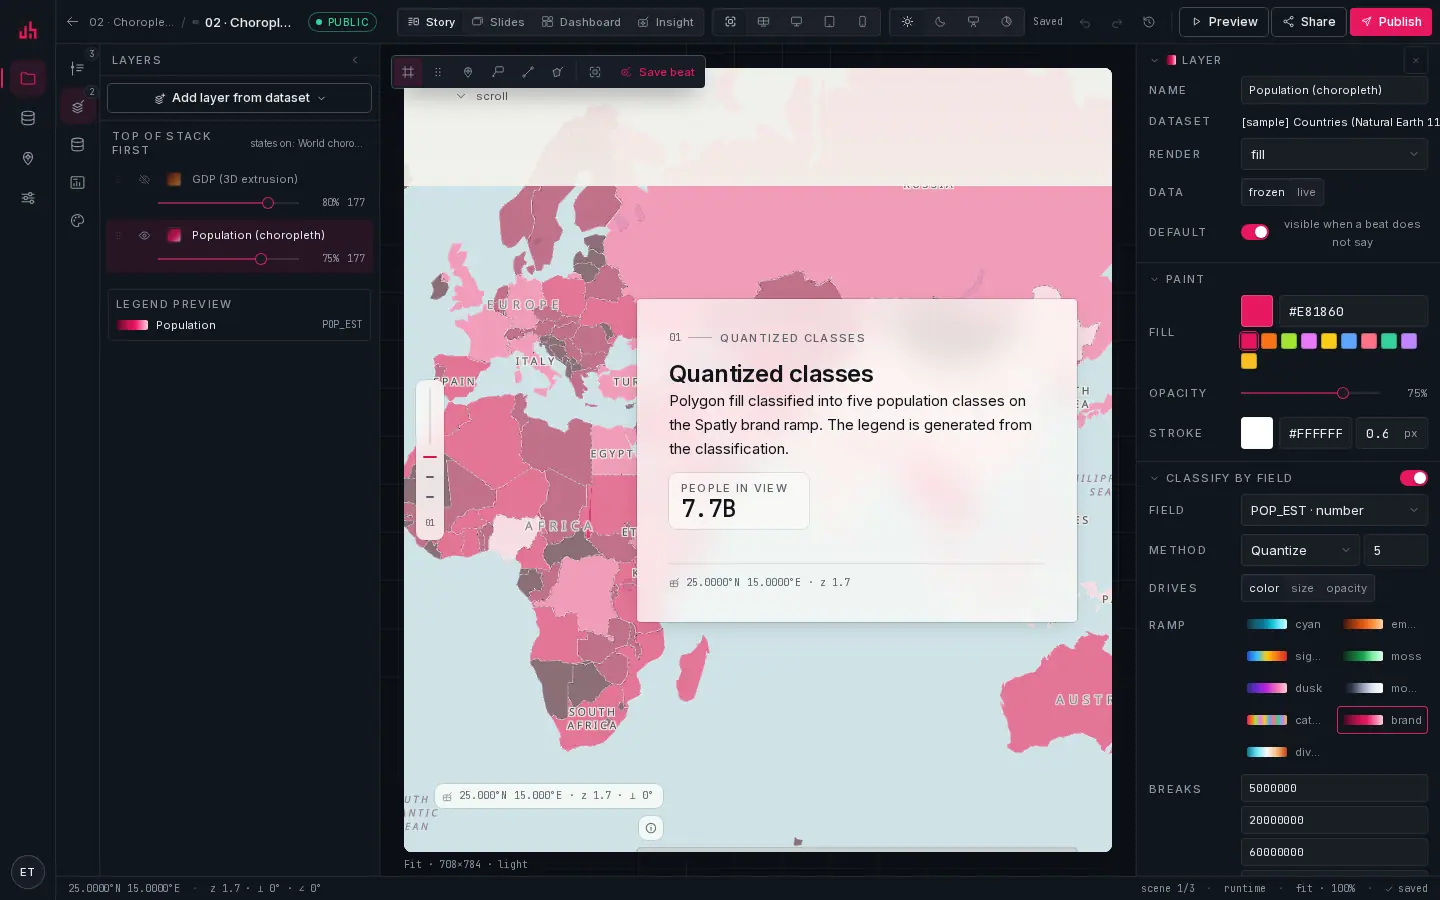
- Add layer from dataset: every dataset attached to the project, plus remote raster and tile sources.
- Layer stack: drag to reorder; the row shows opacity and the feature count.
- Visibility and opacity: the eye and the slider are per layer here, and can be overridden per beat.
- Legend preview: what readers will see, generated from the classification.
- Render: changing this recompiles the MapLibre layer in place; nothing is lost.
- Data:
frozenorlivefor this layer at publish time. - Paint: fill, opacity and stroke; the swatch row is the workspace palette.
- Classify by field: switch it on to drive paint from data.
- Method: categorical, quantize, equal, jenks, interpolate.
- Drives: which property the classification controls: colour, size, opacity or height.
- Ramp: nine built-in ramps; brand first, diverging last.
- Breaks: the class edges. The method proposes them from the field statistics; you can edit any of them.
Render types
| Type | Geometry | Style keys that matter |
|---|---|---|
circle | points | size, color, strokeColor, strokeWidth, blur |
fill | polygons | color, opacity, strokeColor, strokeWidth |
line | lines (and polygon outlines) | size (width), dash, color, arrow (arrowheads — see below) |
symbol | points | markId (a Spatly mark loaded as an SDF image), iconSize, textField, textSize, textColor, textHalo |
heatmap | points | heatRadius, heatWeightField, maxzoom |
fill-extrusion | polygons | heightField, heightScale, color; needs a pitched camera to read |
raster | remote XYZ / WMS / WMTS | remoteSource.tiles, tileSize, attribution, opacity |
hillshade | terrain-RGB tiles | remoteSource, opacity |
Arrowheads on a line
A line says where; an arrowhead says which way. style.arrow draws a Spatly mark at the end of every line in the layer, rotated to the line's own heading:
{
  "color": "#22D3EE",
  "size": 2.5,
  "arrow": { "markId": "chevron", "size": 0.8, "at": "end", "label": "{{spread_km}} km" }
}
| Key | Meaning |
|---|---|
enabled | default true when the block is present; false keeps the block but draws no head |
at | end (default), center, or both |
markId | any SDF map marker — chevron, triangle, diamond, vehicle. It takes the line colour |
size | icon-size multiplier (default 0.7) |
color, labelColor | override the line colour for the head / its label |
rotateField | a property holding a compass bearing (degrees clockwise from north) that wins over the geometry — a wind direction, a forecast heading |
rotateOffset | degrees added after rotation, for a mark that does not point "up" at 0° |
label, labelSize | text beside the head; {{field}} placeholders are filled from the feature |
The heads are derived on the client (one point per line end) from the dataset's GeoJSON, so the layer needs a GeoJSON-served dataset — the same requirement arc and hexbin have. The head inherits the layer's filter, visibility and opacity, so a beat that hides the layer hides its arrows too.
Anything the compiler does not express is available through style.raw, a MapLibre paint / layout object merged last, so it always wins:
{ "raw": { "paint": { "circle-radius": ["interpolate", ["linear"], ["get", "mag"], 1, 2, 4, 6, 7, 16] } } }
Classification
Pick a field, a method and what it drives. The field statistics collected at ingest (min, max, distinct values, nulls) are what the method uses to propose breaks.
| Method | For | What it produces |
|---|---|---|
categorical | text fields | one colour per value from the ramp; unmatched values take nullColor |
quantize | numbers | n equal-count classes, a step expression on the map |
equal | numbers | n equal-interval classes between min and max |
jenks | numbers | natural-breaks classes; best when the distribution is lumpy |
interpolate | numbers | a continuous ramp, an interpolate expression, no classes |
target decides what the classification drives: color (default), size (with sizeRange: [min, max]), opacity or height (extrusions).
{
  "field": "POP_EST",
  "method": "quantize",
  "stops": [5000000, 20000000, 60000000, 150000000],
  "ramp": "spatly-brand",
  "target": "color",
  "nullColor": "#d4d4d4"
}
Ramps
spatly-brand · spatly-categorical · spatly-cyan · spatly-ember · spatly-signal · spatly-moss · spatly-dusk · spatly-mono · spatly-diverging. A ramp can also be an explicit array of colours. Categorical data should use spatly-categorical; a value that runs low-to-high should use a sequential ramp; a value with a meaningful middle should use spatly-diverging.
tipa classification whose target is size reads better than colour for point data over a busy basemap, because size survives the map's own contrast.
Labels and marks
A symbol layer draws a Spatly mark as an SDF image, so it takes color from the style, and optionally a label from a field:
{ "markId": "pin-solid", "iconSize": 0.9, "textField": "iata_code", "textSize": 11, "textColor": "#ffffff", "textHalo": "#0b0f14" }
Keep labels on their own layer in the label slot with a baseFilter narrowing them to the features worth naming. Labelling everything at world zoom produces a grey smear.
3D extrusion
fill-extrusion with heightField and heightScale extrudes polygons; the classification can drive colour at the same time. Set a pitch on the beat (45 to 60°) or the extrusion is invisible. Keep the flat choropleth underneath at low opacity so the base still reads.
Remote raster and vector tiles
Add a layer from a URL instead of a dataset:
- XYZ / WMS / WMTS raster:
remoteSource.tiles: ["https://…/{z}/{x}/{y}.png"],tileSize256 or 512, plus theattributionstring the provider requires. - Vector tiles: a TileJSON or XYZ address plus a
sourceLayername; without the source layer MapLibre has nothing to draw.
Datasets above roughly 5,000 features are served as Spatly's own vector tiles (ST_AsMVT) at /api/v1/tiles/:datasetId/{z}/{x}/{y} and behave the same way. The difference is only where the tiles come from.
noteon a tiled layer, feature counts and client-side filters describe what is currently loaded in the viewport, not the whole dataset. Metrics stay correct because they are computed server-side.
Interactivity
Per layer:
| Key | Effect |
|---|---|
hover | a tooltip built from tooltipFields |
click | a popup anchored to the feature |
titleField | the popup heading |
tooltipFields | the rows in tooltip and popup |
popupTemplate | a {{field}} template that replaces the default rows |
rows | labelled rows whose value is a {{field}} template — used instead of tooltipFields |
media | a clip or image played inside the popup — see below |
**{{place}}** · M{{mag}}
Depth {{depth}} km · {{time_iso}}
Labelled popup rows
tooltipFields prints one raw field per row under its raw name; popupTemplate replaces the whole body with free markdown. rows is the middle ground — an author-named label beside a templated value:
[
  { "label": "Spread", "template": "{{spread_dir_label}} · {{spread_km}} km · {{spread_kmh_3h}} km/h" },
  { "label": "Sources", "template": "{{sources}}", "valueLabels": { "firms_eu": "FIRMS", "slstr_b": "SLSTR-B" } },
  { "label": "FRP", "template": "{{frp_max}} MW", "decimals": 1 },
  { "template": "{{expected_note}}" }
]
valueLabels renames a raw value on its way into the row — and a comma-separated list item by item ("firms_eu,slstr_b" → "FIRMS, SLSTR-B"), through the same helper tableWidget.columns uses, so a popup and a table never disagree about what a key is called. decimals fixes the decimal places of every numeric placeholder in the row (otherwise numbers print grouped, to at most three places).
A row with no label prints as a full-width note line. A row whose placeholders all resolve empty is dropped, so a feed that has not started carrying a field yet shows fewer rows rather than Spread: · km; set hideWhenEmpty: false when the literal text is the point. Up to 12 rows are printed. When rows is present it replaces the tooltipFields rows in the popup (the hover tooltip still uses tooltipFields).
In a published scroll story the camera is beat-driven, so wheel-zoom over the map scrolls the narrative instead. Hover, click and popups still work.
Media in popups
A popup can play a clip or an image that belongs to the feature, inline — no download, no leaving the page. Set interactive.media on the layer:
{
  "videoField": "video_url",
  "posterField": "poster_url",
  "imageField": "image_url",
  "expiresField": "expires_at",
  "autoplay": true
}
| Property | Default field | Contract |
|---|---|---|
| clip | video_url | a direct URL to an MP4 (or anything the browser plays). Rendered as a <video> above the property rows, sized to the popup |
| still | poster_url | the poster behind the play button. Optional |
| image | image_url | shown as an <img> when the feature has no clip |
| expiry | expires_at | an ISO timestamp. Once it is in the past the popup shows its property rows and no media — a feed that signs its URLs for 48 h stops offering dead links. A missing or unreadable expiry is not an expiry |
It is opt-in, and that is deliberate. A layer with no media never shows media, so attaching a dataset that happens to carry a video_url column does not make the map start playing on its own. What the Studio does instead: when the dataset carries those fields the Media toggle in Interactivity says detected, and switching it on fills every field name in for you. One click, no typing, no surprises.
Every field name is yours to change; the defaults above are just the contract most feeds already speak — the same one videoWidget reads.
Autoplay is always muted (browsers require it) and does not start at all when the reader asks for reduced motion; the frame is reserved at 16:9 before the file loads, so the popup does not jump. When the surface also carries a videoWidget, the popup grows an Open in panel button that selects the feature and scrolls the big player into view. A media-only layer opens a popup only for the features that actually carry live media — never an empty card.
Legend
legend.show puts the layer in the viewer's legend under legend.title. For a classified layer the legend is generated from the classification: classes for quantize/equal/jenks, a gradient for interpolate, one swatch per value for categorical. On a dashboard the legendWidget can go further: with click to filter on, clicking a class hides that category in every widget, not only on the map.
Filters
Three filters stack, and they are ANDed:
baseFilteron the layer, always on.- the per-beat
filterinlayerStates, the chapter's own narrowing. - the runtime filter store, which is what a reader does with dashboard filters and selections.
All three are MapLibre expressions:
[">=", ["get", "mag"], 5]
["all", [">=", ["get", "time_iso"], "2024-04-01"], ["<=", ["get", "time_iso"], "2024-04-30T23:59:59Z"]]
["==", ["get", "type"], "major"]
Zoom hand-over
Give a heatmap a maxzoom and the circles a minzoom that overlap by a zoom level or two: the density view resolves into individual features as the reader zooms, without a hard cut.
Verified on 2026-09-02 against the local development build (sample projects 01, 02, 04, 06 and 07).
Something wrong or missing? Write to hello@spatly.io.