Insight Containers
A portable, embeddable spatial insight object: a designed collapsed card that opens into the full workspace, on your site or in someone else's.
Two states, one binding
An Insight Container has two layouts bound to the same project, the same metrics and the same beats:
- Collapsed: a designed card: mini map, 2 to 4 KPIs, a short narrative and one call to action.
- Expanded: the full workspace: a bigger map, charts, a table and filters. A dashboard in everything but name.
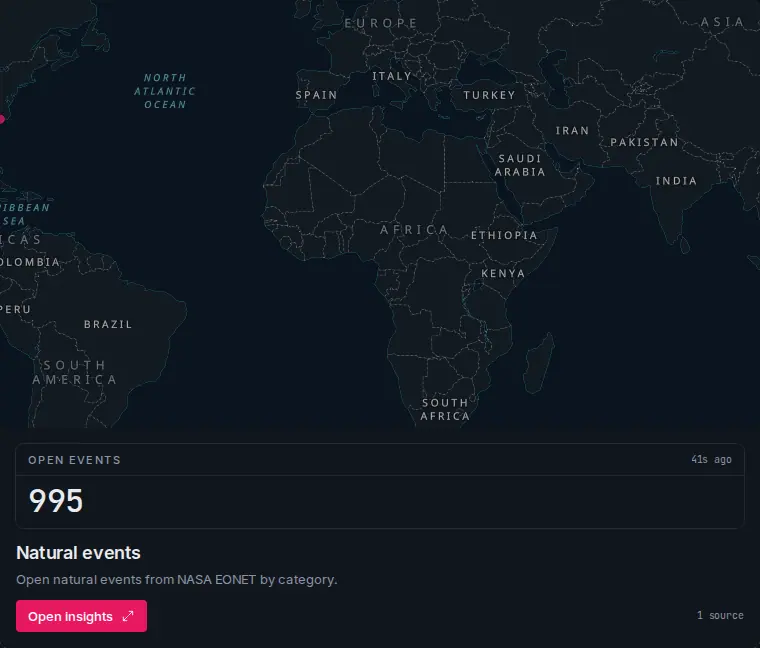
- Mini map: non-interactive by default, framed on the collapsed beat.
- KPI: a live metric with its own as-of stamp. Up to four fit comfortably.
- Narrative: a title and one or two sentences. Not a paragraph of context; a reason to open it.
- Open insights: the call to action. Its label is yours (
cta).
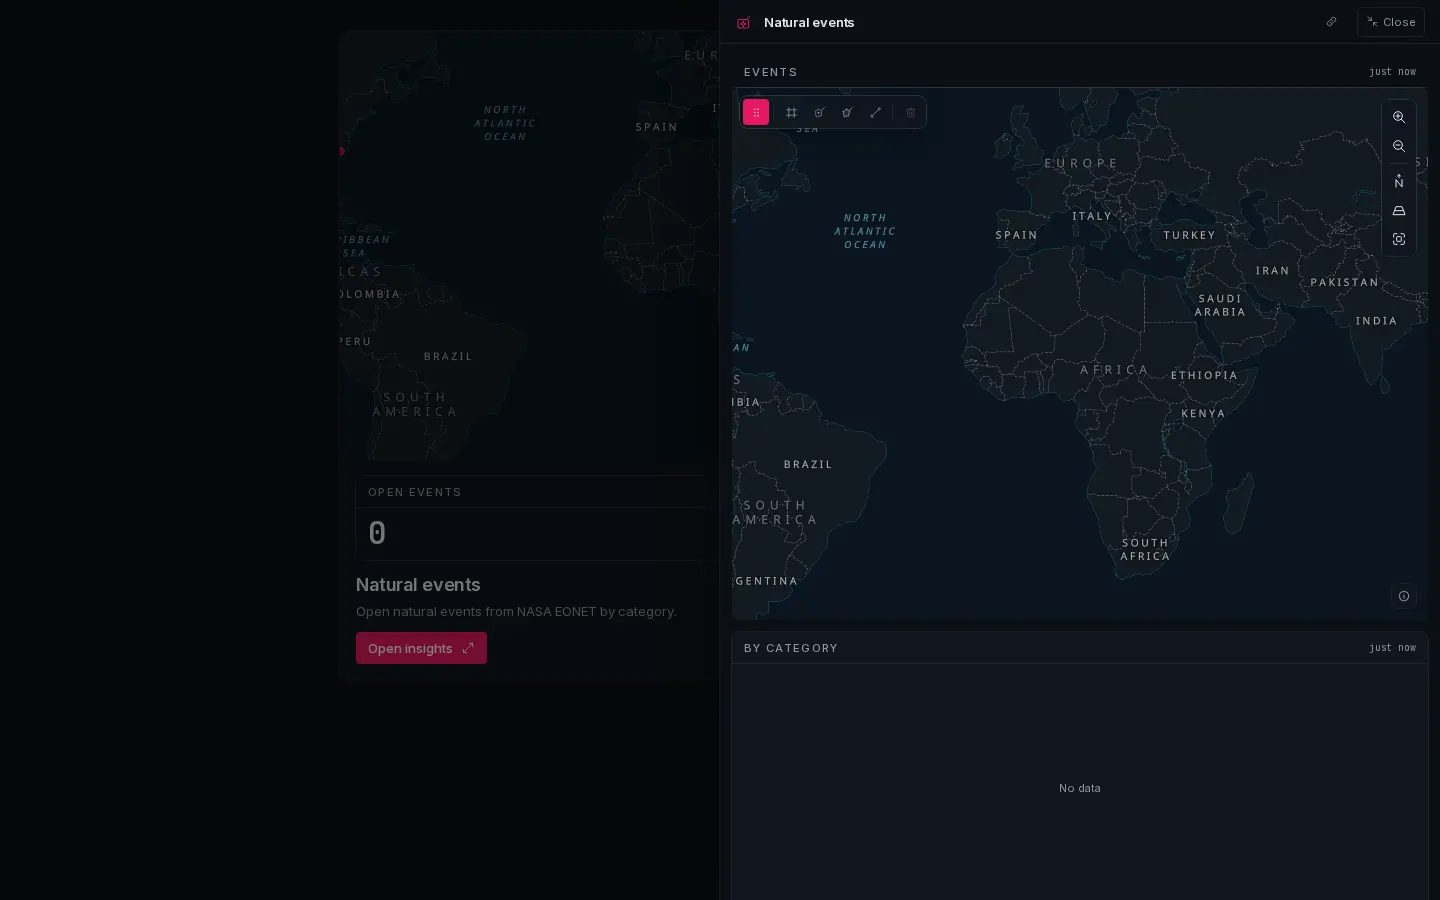
- Expanded map: interactive, and the target of every filter in the expanded layout.
- Chart: the same metric, now with its breakdown.
- Table: the underlying features, sortable and exportable.
Props
{
  expandMode: "drawer",        // drawer · modal · inline · route
  cta: "Open insights",
  beatId: "<collapsedBeat>",
  expandedBeatId: "<expandedBeat>",
  refreshSec: 60,
  variant: "dark"              // light · dark
}
expandMode | Behaviour | Use it when |
|---|---|---|
drawer | slides in from the right on desktop, a full-screen sheet on a phone | the default; the host page stays visible behind it |
modal | centred overlay | the expanded view is the whole point and the page behind is noise |
inline | the card grows in place, pushing the page | inside a narrow column, or when overlays are disallowed |
route | navigates to the full surface | the expanded view deserves its own URL and back button |
Authoring
Open the project in Studio and switch to Insight. The Scenes rail has exactly two scenes, Collapsed and Expanded, and each is a normal canvas you fill from the Library.
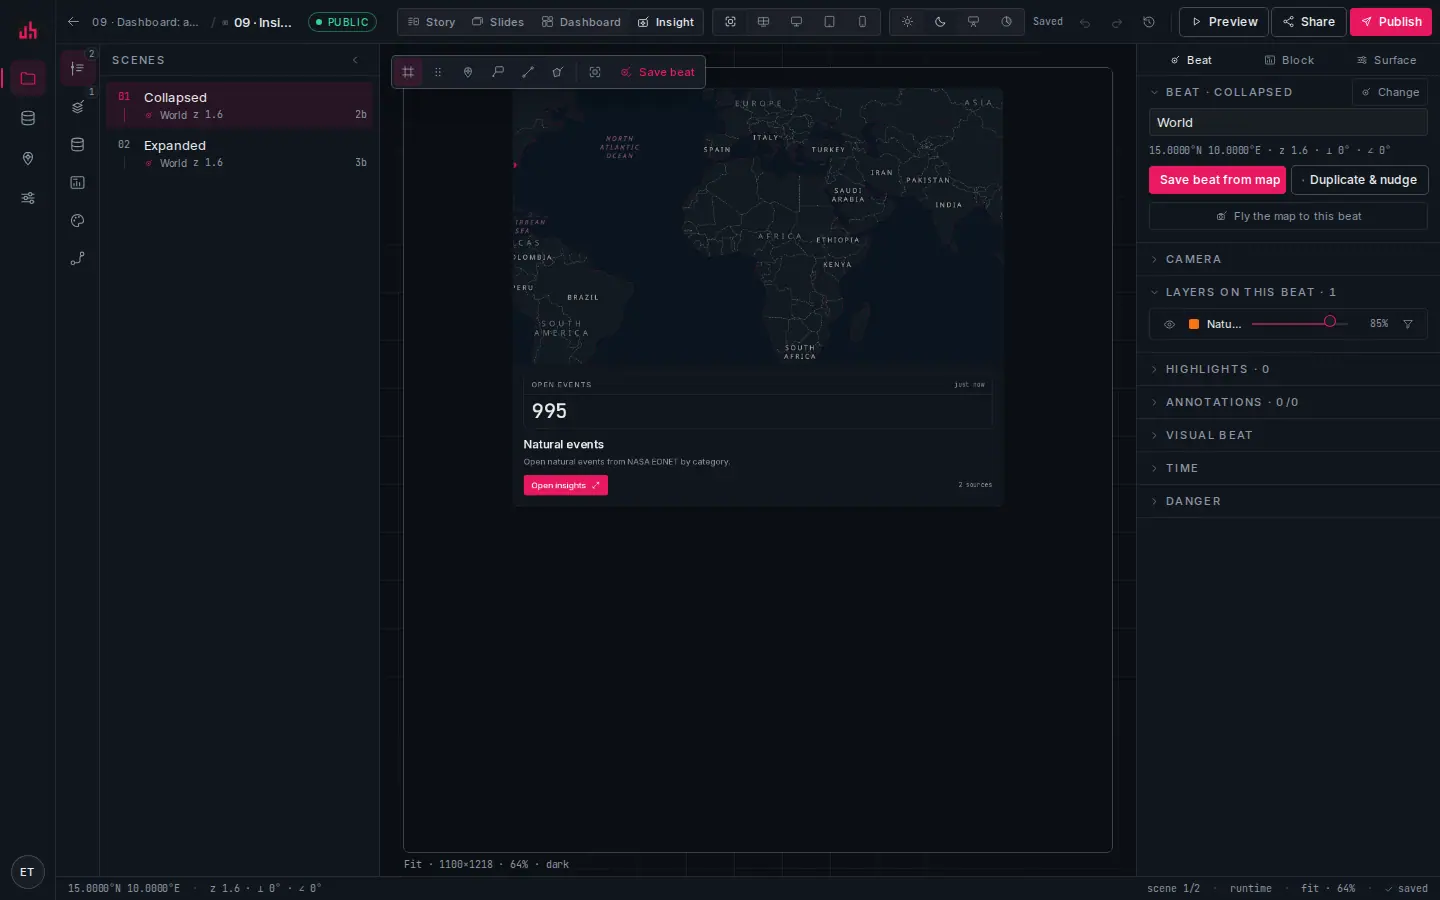
- Scenes: Collapsed and Expanded. There are always exactly two.
- Canvas: the real card at its real size; what you see is what the embed renders.
- Inspector: expand mode, the call-to-action label, refresh interval and variant.
noteblocks inside an Insight Container are selected from the Scenes rail and the inspector rather than by clicking them on the canvas. Placement and binding work normally; only click-to-select on the card itself is unavailable.
Where it lives
- on a Spatly dashboard, as an
insightWidget - inside a story chapter, as a block
- on any website, via the embed script or a plain iframe
- inside your own app, wired to
postMessage
<div data-spatly="<publicId>" data-height="420"></div>
<script async src="https://spatly.io/embed.js"></script>
The loader listens for spatly:expand and grows the iframe to min(90vh, 900px) when the container opens, then restores the previous height when it closes, so a drawer expand works inside a host page's grid without the host writing any code.
Events
The expanded state emits the same events as a dashboard, and the embed runtime forwards them:
| Message | Payload | When |
|---|---|---|
spatly:ready | { publicId } | the surface has rendered |
spatly:resize | { height } | the content height changed |
spatly:expand | { expanded } | opened or collapsed |
spatly:beat | { beatId } | the active beat changed |
spatly:select | { datasetId, featureIds } | the reader selected features |
See Embedding for the full contract, including the messages you can send into the container.
Live by default
Insight Containers poll their metrics on refreshSec (60 s by default; 0 turns polling off). Each KPI carries an as-of stamp, and a source that misses its window is marked stale rather than silently showing an old number. See Data & live sources.
Analytics
Every published container records view, expand, select and scene events, from embeds too, so a container on a partner's site reports back the same way. The share page shows views, the expand rate and the most-selected features. No personal data is recorded; see Publishing.
From an agent
list_kpis { projectId }                                  → pick up to four metric ids
create_insight_container { projectId, name: "Seismic activity, last 24h",
                           text: "…", metricIds: [...], bbox: [25,35,45,43], cta: "Open insights" }
publish_share_link { surfaceId, visibility: "public" }    → { publicId, url, embedUrl }
Verified on 2026-09-02 against the local development build (sample project 09).
Something wrong or missing? Write to hello@spatly.io.